25 CUDA Concepts Explained, From Threads to Tensor Cores

You move a tensor to the GPU, run the same code, and it finishes in a fraction of the time. Nothing about your program changed except one line. So what actually happened?
Most CUDA material answers that question in one of two ways. Either it stays at the level of “GPUs are parallel, so they’re faster,” which explains nothing, or it drops you into grid dimensions and memory fences on page two. There is a useful middle layer, and that is what this is.
These are the 25 concepts that make GPU behaviour predictable instead of mysterious. You do not need to write CUDA to get value from them. Knowing them changes how you read a profiler, why one implementation is faster than another, and what to try when something is slow.
1. What CUDA actually is
CUDA is a way to write code that runs on the GPU instead of the CPU.
It stands for Compute Unified Device Architecture, which tells you nothing useful. What matters is that it is NVIDIA’s platform, it only runs on NVIDIA hardware, and it consists of a language extension to C++, a compiler, a runtime, and a large stack of libraries built on top.
When people say “GPU programming” in a machine learning context, they almost always mean CUDA. Competing options exist, but the ecosystem, the tooling, and the libraries are the reason CUDA is the default.
The important thing to understand is that you are almost certainly using it already. If you have ever run a model on an NVIDIA GPU, CUDA was doing the work several layers below whatever you typed.
2. Why GPUs are shaped differently from CPUs
A CPU has a small number of very capable cores. They run complicated logic, predict branches, reorder instructions, and handle unpredictable work well. A desktop CPU might have sixteen of them.
A GPU has thousands of much simpler cores. Individually they are unimpressive. Collectively, when every one of them is doing the same operation on different data, they finish work a CPU would take far longer to grind through.
The trade is flexibility for throughput. A CPU is a handful of senior engineers who can solve any problem you hand them. A GPU is a very large team that can only do one kind of task, but can do enormous amounts of it at once.
This is why GPUs are excellent for matrix multiplication and image processing, and poor at things like parsing a config file. It also explains almost every performance rule that follows.
3. The kernel
A kernel is a function that runs on the GPU.
You write it in C++ with a marker on it, you call it from ordinary host code, and it executes on the device. That is the whole idea. The name sounds more imposing than the concept deserves.
The marker is one of three. A function tagged __global__ is a kernel: you
call it from the CPU and it runs on the GPU. One tagged __device__ runs on
the GPU but can only be called by other GPU code, so it is how you break a
kernel into smaller functions. Anything tagged __host__, which is the
default, is an ordinary CPU function.
The difference from a normal function is that a kernel does not run once. You launch it with a shape, and it runs many thousands of times in parallel, each instance working on a different slice of the data.
There is a catch worth knowing early. GPU code is C++, but not all of it. No
exceptions, no virtual functions, and no calling ordinary host functions, which
includes ones as innocent as toupper. The compiler’s way of telling you is
calling a __host__ function from a __global__ function is not allowed, which
is baffling the first time you see it and obvious ever after.
In PyTorch or TensorFlow you never see any of this. Every tensor operation you write, every addition and convolution and activation, is launching CUDA kernels underneath.
4. Threads
A thread is one instance of your kernel.
If you are adding two arrays of a million elements, you might launch a million threads, and each one adds a single pair of numbers. No thread knows about the others. Each does its own tiny piece.
Thinking in threads is the part that takes adjustment. On a CPU you write a loop over the data. On a GPU you write the body of the loop and let the hardware supply the iterations. The loop disappears, which feels wrong for a while and then feels natural.
// CPU: one thread walks the entire array
for (int i = 0; i < n; i++) {
    out[i] = in[i] * scale;
}

// GPU: you write only the body. The hardware supplies the iterations,
// and each thread works out which one belongs to it.
__global__ void scale(const float* in, float* out, float s, int n) {
    int i = blockIdx.x * blockDim.x + threadIdx.x;
    if (i < n) out[i] = in[i] * s;
}
The loop counter became an identity. That if on the last line exists because
the number of threads launched is rarely an exact multiple of the data size, so
the leftovers have to be told to do nothing.
5. Blocks
Threads are grouped into blocks.
The reason is physical. Threads within a block run on the same processing unit on the chip, so they can share fast local memory and coordinate with each other. Threads in different blocks cannot do either. They may not even be running at the same time.
You choose the block size when you launch. It is typically 128, 256, or 512 threads, and it should be a multiple of 32 for reasons that become clear in concept 10.
The block is the unit of cooperation. Any time you want threads to work together on shared data, you are designing around block boundaries.
6. The grid
The grid is the complete set of blocks in one kernel launch.
So there are two levels. The grid holds blocks, and each block holds threads. When you launch a kernel you specify both numbers, and together they determine how many threads run in total.
Stadium seating is a reasonable picture. The grid is the whole stand, blocks are the numbered sections, and threads are individual seats. Every seat has exactly one address, and knowing your section and seat number is enough to find it without anyone coordinating.
The grid can be one, two, or three dimensional, which is a convenience rather than a hardware feature. Processing an image is easier to reason about with a 2D grid because the coordinates map to pixels directly.
7. Thread indexing
Every thread runs identical code, so each one has to work out which data belongs to it.
It does that from its coordinates. A thread knows which block it is in and where it sits within that block, and from those two numbers it computes a unique global index. The standard form is the block index multiplied by the block size, plus the position within the block.
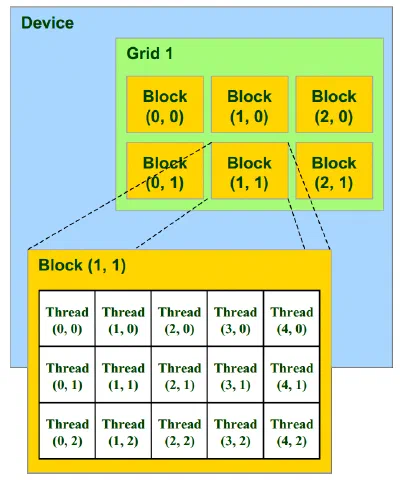
This is where beginners lose hours. Get the arithmetic wrong and you rarely get a crash. You get results that are correct in the middle and wrong at the edges, or an output with a stripe of garbage through it, because some threads computed an index nobody owned.
You also have to handle the case where your data size is not an exact multiple of your block size. The last block will have threads with nothing to do, and they have to be told to stop rather than write past the end of the array.
8. Kernel launches are asynchronous
When you launch a kernel, the CPU does not wait for it. It queues the work and immediately moves to the next line.
This is deliberate and it is what makes pipelines fast. Your CPU can be preparing the next batch while the GPU is still working on the current one.
It also means CPU-side timers around GPU code measure nothing useful. You are timing how long it took to add the work to a queue, which is close to zero. This is the single most common source of impossible benchmark results, and almost everyone hits it at least once.
9. Synchronization
Sometimes you need the CPU to actually wait. Before you read results back, before you time something, before you rely on the GPU having finished.
That is what synchronization does. It blocks until the queued work is complete.
In PyTorch you would call torch.cuda.synchronize().
The subtlety is that plenty of operations synchronize without announcing it. Copying data back to the host does. Printing a tensor value does. Anything that converts a GPU result into a Python number does, because the number has to exist before it can be printed.
If a pipeline is slower than the sum of its parts suggests, look for one of these. They collapse your carefully overlapped work back into a serial chain, and they are invisible in the source until you know the pattern.
10. Warps
The hardware does not schedule threads one at a time. It schedules them in groups of exactly 32, called warps, and every thread in a warp executes the same instruction simultaneously.
This is the most useful single fact about GPU execution. It explains why block sizes should be multiples of 32. It explains why an array of 33 elements uses two warps and wastes 31 lanes of the second one. And it explains the next concept, which is where a lot of real performance goes missing.
11. Warp divergence
If threads in the same warp take different branches of an if, the hardware
cannot run both paths at once.
It runs one path with the threads that took it, while the others sit idle. Then it runs the other path with the roles reversed. You pay for both branches instead of one.
A conditional that splits a warp roughly doubles the cost of that section. A conditional where all 32 threads agree costs nothing extra, because there is only one path to take.
This is why branch-heavy per-element logic performs badly, and why it is often faster to compute both results and select between them arithmetically than to branch at all. It is also an argument for deciding things before the launch rather than inside the kernel. If every thread is checking the same flag a million times, that flag should have been resolved on the host.
12. Occupancy
Occupancy is how many warps are resident on the hardware compared to the maximum it could hold.
It matters because of latency hiding. When a warp stalls waiting on memory, the scheduler switches to another warp that is ready. With plenty of resident warps, those stalls disappear into other work. With very few, they become dead time.
The trap is treating occupancy as a score to maximize. Beyond a certain point you are giving up registers and shared memory per thread in exchange for more threads, and a kernel with fewer, better-resourced threads often wins. Very low occupancy is worth investigating. Sixty percent may be exactly right.
13. Register pressure
Each thread gets its own registers, and each processing unit has a fixed pool of them to hand out.
The more registers a single thread needs, the fewer threads can be resident at once, which pushes occupancy down. Push further and the compiler starts spilling registers into memory, and performance drops sharply for a reason that is nowhere in your source code.
A kernel that got noticeably slower after you added a few local variables is usually this. The compiler will tell you the register count per thread if you ask it to, and that number is worth looking at before you start guessing.
14. Host memory and device memory
The CPU and the GPU have separate memory. Host memory is your system RAM. Device memory is the GPU’s own.
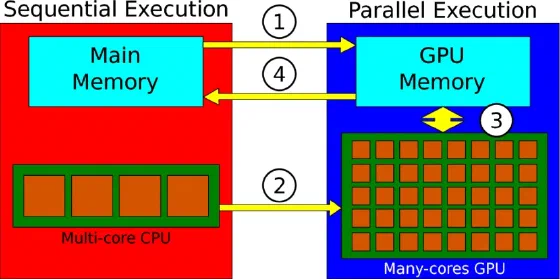
A pointer from one is meaningless to the other. Passing a host pointer to a kernel does not produce a helpful error, it produces a crash or garbage. This is the source of a large fraction of early CUDA bugs, and it is why frameworks are so insistent about which device a tensor lives on.
Everything the GPU works on has to be in device memory first. In raw CUDA that
means cudaMalloc to reserve it and cudaMemcpy to fill it, and the copy
takes a direction argument saying which way the bytes are going. Which leads
directly to the next concept.
15. The transfer bottleneck
Moving data between host and device costs time, and on a discrete GPU it costs
a lot, because the data crosses a physical bus. Every cudaMemcpy in a profile
is one of these crossings.
The failure mode is a pipeline where the kernel is genuinely fast and the program is not. If your computation takes one millisecond and the round trip takes ten, you have built a slower version of what you started with.
The fix is a strategy rather than a trick. Move data to the GPU once, do as much work there as possible, and bring back only what you need. This is exactly why deep learning frameworks push so hard to keep tensors on the device and why accidentally pulling one back to the CPU mid-pipeline is such a common performance bug.
On integrated GPUs, where the CPU and GPU share physical memory, this cost is smaller but it does not vanish. A standard copy still stages through an intermediate buffer unless you allocate specifically to avoid it.
16. Pinned memory
Ordinary host allocations can be moved around by the operating system. Because their physical address is not stable, the GPU cannot safely read them directly, so transfers stage through a temporary buffer the runtime manages.
Pinned memory is host memory locked in place. Its address does not move, so the GPU can access it directly and transfers can overlap with computation instead of blocking.
The cost is that pinned pages cannot be swapped out. Allocate too much and you constrain the whole system. It is a trade, and worth measuring rather than applying everywhere by reflex.
17. Unified memory
Unified memory gives you a single pointer that is valid on both the host and the device, and lets the system move pages between them as needed.
It is genuinely convenient, especially when you are learning, because it removes an entire category of pointer bugs. The cost is that migration happens behind your back. A page fault at the wrong moment produces a stall you did not write and cannot easily see.
For getting something working it is excellent. For a tuned pipeline, explicit allocation and explicit copies give you control that is hard to give up.
18. Global memory
Global memory is the large pool in device memory that every thread can reach. It is where your data lives.
It is also slow relative to everything else on the chip. Modern GPUs can perform far more arithmetic per second than they can feed themselves data for, which means most real kernels are limited by memory bandwidth rather than compute.
That is worth sitting with, because it inverts the intuition most people bring from CPU optimization. When you tune a CUDA kernel you are usually reducing memory traffic, not reducing calculations.
19. Memory coalescing
The GPU does not fetch one value at a time. It fetches a contiguous chunk in a single transaction.
So if the 32 threads of a warp read 32 consecutive addresses, the hardware serves them all in one or two transactions. If those same threads read scattered addresses, it issues far more transactions to deliver the same amount of data, and you get a fraction of the bandwidth you paid for.
This is why the memory layout of your data matters as much as your algorithm. The classic example is a matrix transpose, where reading down a column strides across memory instead of along it. A naive transpose can be several times slower than one that stages through shared memory so both the reads and the writes stay contiguous.
If you only remember one optimization concept from this list, this is the one.
20. Shared memory
Shared memory is a small, fast pool that all threads in a block can read and write. It is managed by you, not by a cache, and it lives on the chip rather than in device memory.
It exists so a block can load data from global memory once, cooperatively, then reuse it many times without going back. Whenever threads need overlapping data, as they do in convolutions, filters, and tiled matrix multiplication, this is where the speedup comes from.
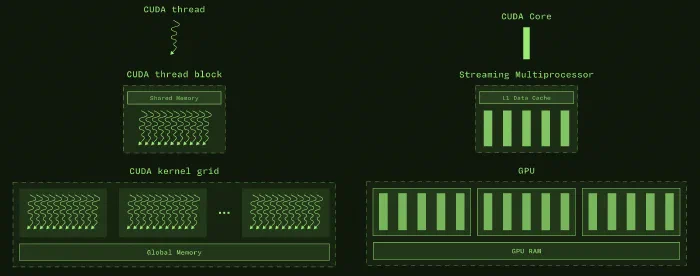
The way it clicked for me is a workbench. The tools you have laid out in front of you are shared memory. The store room at the far end of the building is global memory. Nothing about the work changed, but fetching a screwdriver from two feet away instead of two hundred feet away changes how long the job takes.
21. Bank conflicts
Shared memory is divided into banks that can be accessed in parallel. If two threads in a warp access different addresses in the same bank, those accesses happen one after another instead of together.
The frustrating part is that you can carefully restructure a kernel to fix coalescing, move everything through shared memory, and then lose much of the gain to bank conflicts you had no idea existed. The standard fix is almost silly: pad each row of your shared array by one element so the stride no longer lines up with the number of banks.
Nobody deduces this from reading their code. You find it in a profiler, which is a good argument for running one before you start optimizing.
22. Kernel fusion
If you run four small kernels in sequence, each one reads its input from global memory and writes its output back, and the next one reads that straight in again. That is four round trips for data that never needed to leave the chip.
Fusing them into a single kernel means reading once, performing all four operations while the values sit in registers, and writing once. You cut memory traffic dramatically, and given concept 18, that is usually the whole game.
This is why frameworks invest so heavily in fusion, and why compiled models are faster than eager ones doing identical arithmetic. The math is the same. The memory traffic is not.
23. Streams
By default your GPU work runs in one queue, in order: copy, compute, copy back. Streams give you several queues that can overlap.
With multiple streams you can be uploading the next batch while the current one is still computing, and downloading the previous result at the same time. Nothing individually got faster. The gaps between operations closed.
This is where pinned memory from concept 16 stops being optional, because overlapping a transfer with computation requires memory the GPU can access directly.
24. Precision and tensor cores
FP32 is the default. FP16 halves your memory traffic. INT8 halves it again.
Given that most kernels are memory-bound, smaller data types are a speedup before any faster arithmetic enters the picture. But faster arithmetic is available too. Tensor cores are dedicated units that compute a small matrix multiply and accumulate in one operation rather than as many separate multiplies, and they only engage at reduced precision.
That is the real reason mixed precision training exists. It is not only about saving memory, it is about routing work onto hardware that is idle at FP32.
The caveat is that lower precision is not free at the accuracy level. INT8 in particular needs calibration, and it is where you start making genuine trade-offs rather than free wins. Anyone who tells you otherwise has not measured recall on the classes they care about.
25. The libraries you are actually using
Almost nobody writes raw CUDA for standard operations, and you should not start.
cuBLAS handles linear algebra. cuDNN handles the neural network primitives: convolutions, pooling, normalization, activations. TensorRT takes a whole network and optimizes it end to end, fusing layers, selecting kernels for your specific hardware, and managing precision.
When PyTorch runs a convolution, it is almost certainly calling into cuDNN. The speed you experience is not CUDA alone, it is a decade of accumulated engineering inside these libraries, tuned per architecture.
Which is the practical takeaway. Learn these concepts so you can reason about performance, choose the right library, and understand what a profiler is telling you. Not so you can outperform NVIDIA at writing convolutions, because you will not.
Where this leaves you
None of this requires writing a single line of CUDA. It changes what you do when the numbers stop making sense.
You stop trusting CPU timers around GPU work. You look at memory traffic before arithmetic. And when a model is slower than it has any right to be, you have somewhere specific to start.
Next time you move a tensor to the GPU, you are launching thousands of threads, grouping them into warps, moving data across memory hierarchies, and calling into libraries that people have been refining for a decade.
Citation#
Cite this post as:
@misc{alam2026cudaconcepts,
  author  = {Alam, Md. Faruk},
  title   = {25 {CUDA} Concepts Explained, From Threads to Tensor Cores},
  year    = {2026},
  month   = aug,
  note    = {Blog post},
  url     = {https://farukalamai.com/blog/25-cuda-concepts-explained-from-threads-to-tensor-cores/}
}